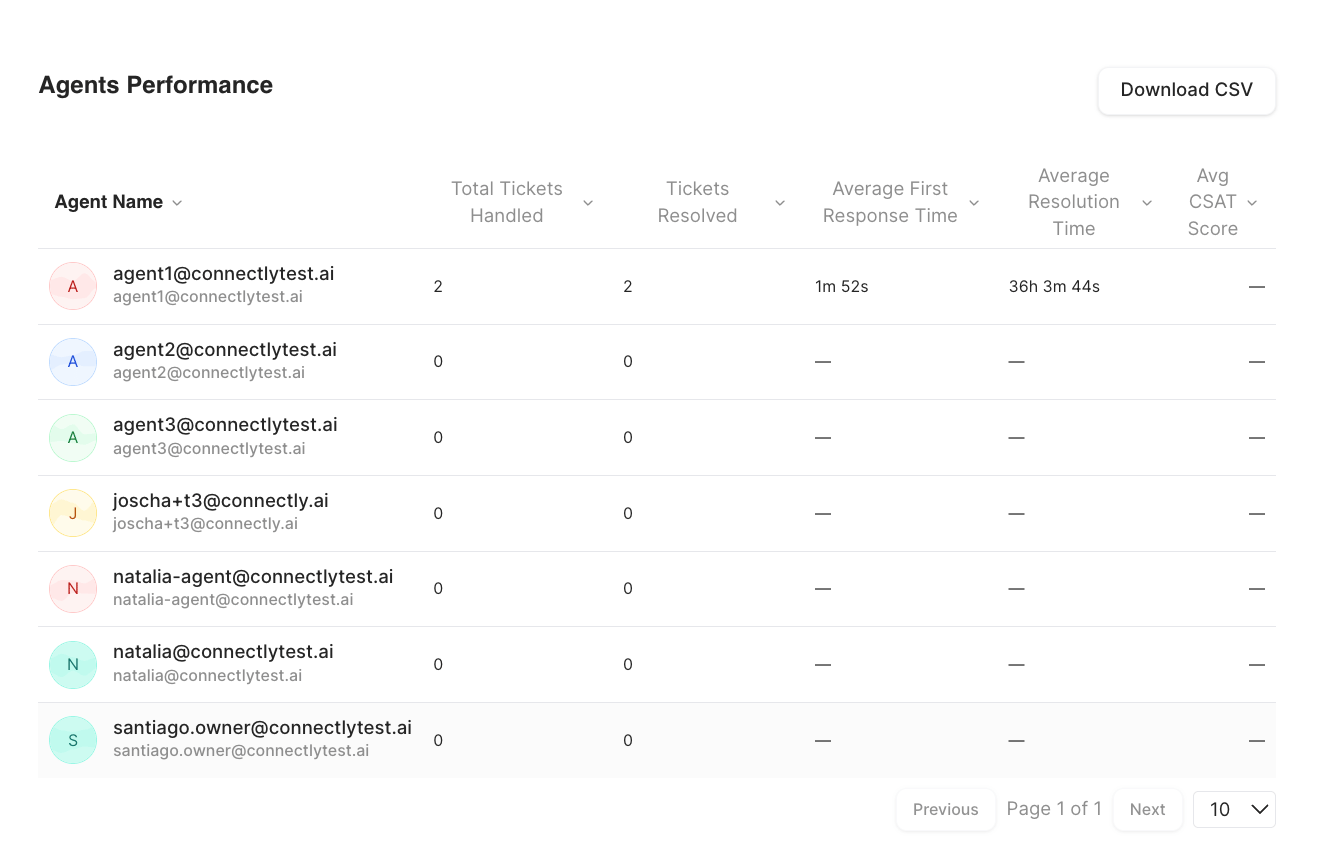
Every table has its own Download CSV, and the export includes more columns than the on-screen view — useful for deeper analysis in a spreadsheet.
All Tickets
A row-per-ticket table for the selected period. On screen it shows:
Click the eye icon on a row to open that conversation in the Inbox.
The CSV export is much richer — it adds fields like the ticket summary, customer contact and channel, final topic, resolution reason, first-response and resolution timestamps, time-to-first-response, average response time, initial/final assignees, number of reassignments, reopen count, and CSAT — roughly two dozen columns in total.
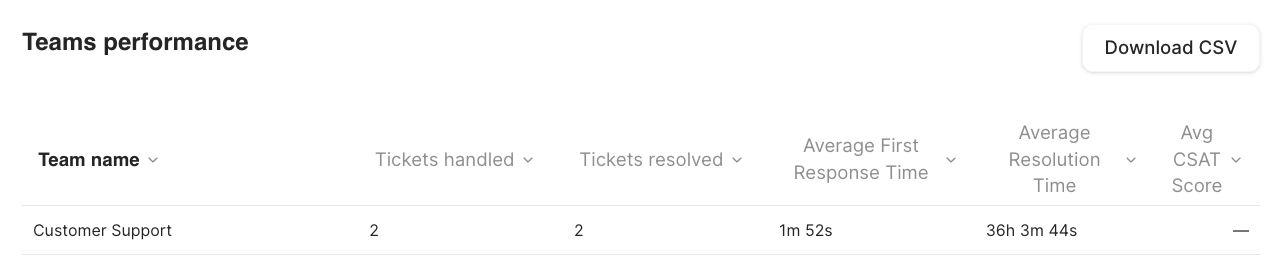
Teams Performance
One row per team, comparing how teams are doing.
The CSV adds reassignment counts (to others / to me) and average response time.
Agents Performance
One row per agent, with the same shape as the teams table.
The CSV adds reassignment counts and average response time.