> ## Documentation Index
> Fetch the complete documentation index at: https://docs.connectly.ai/llms.txt
> Use this file to discover all available pages before exploring further.
# Analytics: tickets, teams & agents
> Dig into per-ticket data and compare performance across teams and agents 📊
Below the headline KPIs, the Inbox analytics page (**Analytics → Inbox**) breaks
performance down to the ticket, team, and agent level. These tables are available to
owners and analytics roles; agents see their own personal card at the end.
Every table has its own **Download CSV**, and the export includes more columns than
the on-screen view — useful for deeper analysis in a spreadsheet.
## All Tickets
A row-per-ticket table for the selected period. On screen it shows:
| Column | What it is |
| -------------------- | ------------------------------------------------------------------- |
| **Ticket Number** | The ticket's number. |
| **Customer Name** | The customer on the ticket. |
| **Created Date** | When the ticket was created. |
| **Status** | Open, Resolved, or Closed. |
| **Current Assignee** | The team and/or agent it's assigned to. |
| **CSAT** | The customer's satisfaction score and label (when CSAT is enabled). |
Click the **eye icon** on a row to open that conversation in the Inbox.
The **CSV export is much richer** — it adds fields like the ticket summary, customer
contact and channel, final topic, resolution reason, first-response and resolution
timestamps, time-to-first-response, average response time, initial/final assignees,
number of reassignments, reopen count, and CSAT — roughly two dozen columns in total.
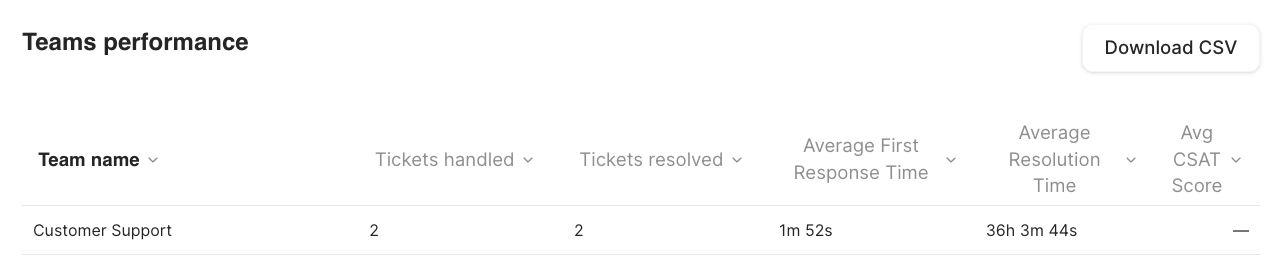
## Teams Performance
One row per team, comparing how teams are doing.
| Column | What it measures |
| ------------------------------- | -------------------------------------------------- |
| **Name** | The team (deleted teams appear as "Deleted Team"). |
| **Tickets Handled** | Unique tickets the team worked on. |
| **Tickets Resolved** | Unique tickets the team resolved. |
| **Average First Response Time** | Average time to the first response. |
| **Average Resolution Time** | Average time to resolve. |
| **Avg CSAT** | Average satisfaction score (when CSAT is enabled). |
The CSV adds reassignment counts (to others / to me) and average response time.
 ## Agents Performance
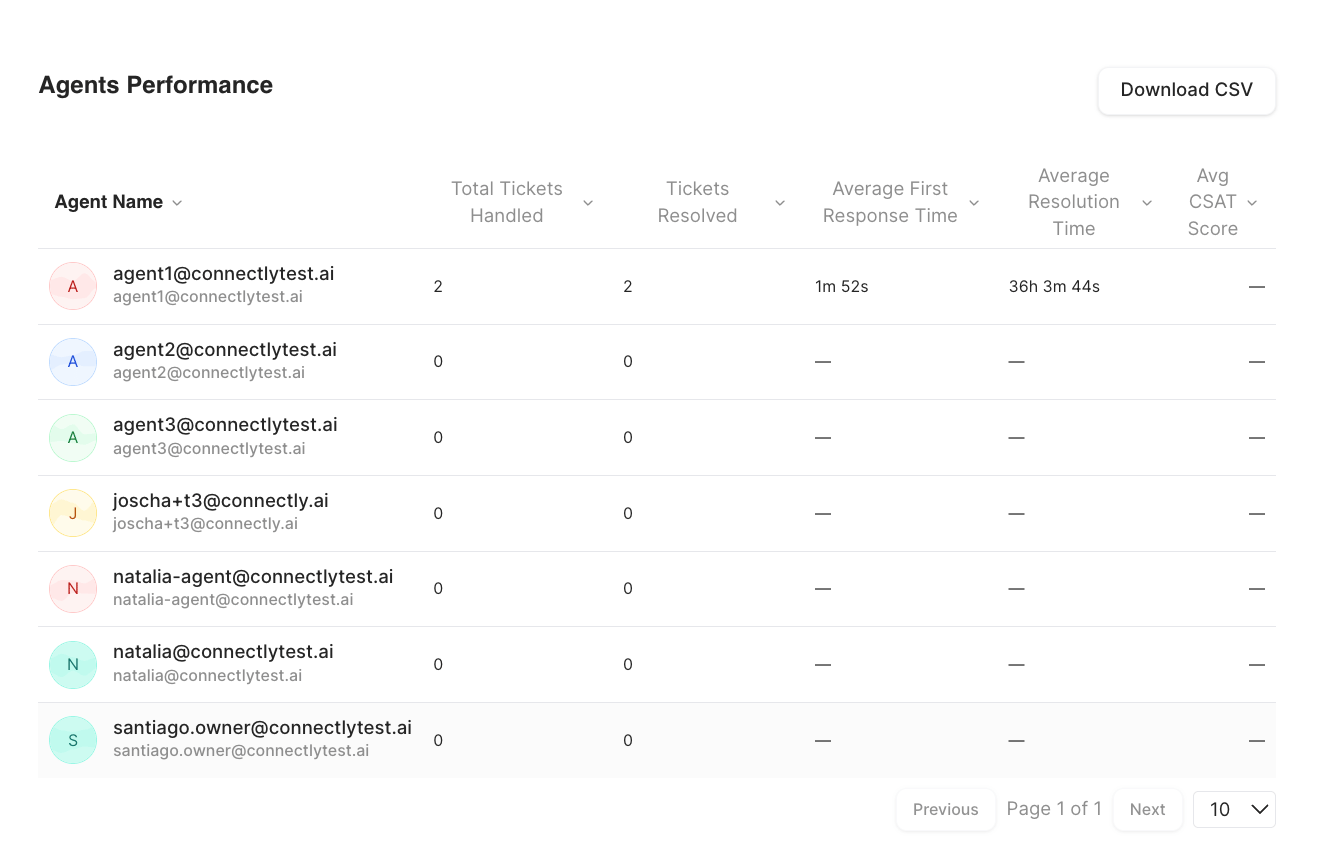
One row per agent, with the same shape as the teams table.
| Column | What it measures |
| ------------------------------- | -------------------------------------------------- |
| **Name** | The agent. |
| **Tickets Handled** | Unique tickets the agent worked on. |
| **Tickets Resolved** | Unique tickets the agent resolved. |
| **Average First Response Time** | Average time to the first response. |
| **Average Resolution Time** | Average time to resolve. |
| **Avg CSAT** | Average satisfaction score (when CSAT is enabled). |
The CSV adds reassignment counts and average response time.
## Agents Performance
One row per agent, with the same shape as the teams table.
| Column | What it measures |
| ------------------------------- | -------------------------------------------------- |
| **Name** | The agent. |
| **Tickets Handled** | Unique tickets the agent worked on. |
| **Tickets Resolved** | Unique tickets the agent resolved. |
| **Average First Response Time** | Average time to the first response. |
| **Average Resolution Time** | Average time to resolve. |
| **Avg CSAT** | Average satisfaction score (when CSAT is enabled). |
The CSV adds reassignment counts and average response time.
 ## Agent Performance (your own view)
When an individual agent opens Inbox analytics, they see a single personal card with
their own numbers for the selected period:
| Metric | What it measures |
| -------------------- | --------------------------------------------------------- |
| **Reassignments** | Times one of your tickets was reassigned to someone else. |
| **Resolutions** | Tickets you marked as resolved. |
| **Tickets Closed** | Tickets you closed. |
| **Tickets Assigned** | Tickets assigned to you. |
| **Close Rate** | Share of your assigned tickets that you closed. |
## Agent Performance (your own view)
When an individual agent opens Inbox analytics, they see a single personal card with
their own numbers for the selected period:
| Metric | What it measures |
| -------------------- | --------------------------------------------------------- |
| **Reassignments** | Times one of your tickets was reassigned to someone else. |
| **Resolutions** | Tickets you marked as resolved. |
| **Tickets Closed** | Tickets you closed. |
| **Tickets Assigned** | Tickets assigned to you. |
| **Close Rate** | Share of your assigned tickets that you closed. |